From the rise of tactile marketing to the video podcasting boom, these are the data points we're paying attention to right now.
7.7%
The percentage of total company revenue allocated to marketing budgets, per a new Gartner survey of more than 400 CMOs and industry leaders across North America, the U.K. and Europe. Unsurprisingly, nearly 60% of respondents also say they lack sufficient funding to execute their strategy this year.
10%
The decrease in impressions generated by traditional search engines over the past 12 months, per new research by AI marketing firm SOCi. The study’s authors attribute this decline to fragmentation: The average consumer now uses three or more separate platforms for online discovery (versus a single search engine), according to SOCi’s data. Social media, navigation apps, review sites and AI platforms are the top alternatives to Google and Bing.
$7.3 billion
The estimated global revenue for the podcast industry in 2024, according to a new analysis by the consulting firm Owl & Co. — nearly double the amount cited in a recent PwC study conducted on behalf of the Interactive Advertising Bureau (IAB). Most of this discrepancy can be attributed to $1.7 billion in video podcast earnings and $700 million in so-called consumer revenue, such as Patreon donations, both of which went uncounted in the PwC/IAB report.
45.1 million
The number of Americans expected to travel domestically over Memorial Day weekend (May 22-26), according to AAA forecasting released Monday. If realized, this figure would represent a new all-time high, surpassing the previous record of 44 million set in 2005.
$0.67
The average cost of a White Castle slider by way of the restaurant’s new 6 for $4 promo — a direct response to the “economic pressures [that] continue to weigh on families nationwide,” per a brand statement.
6 in 10
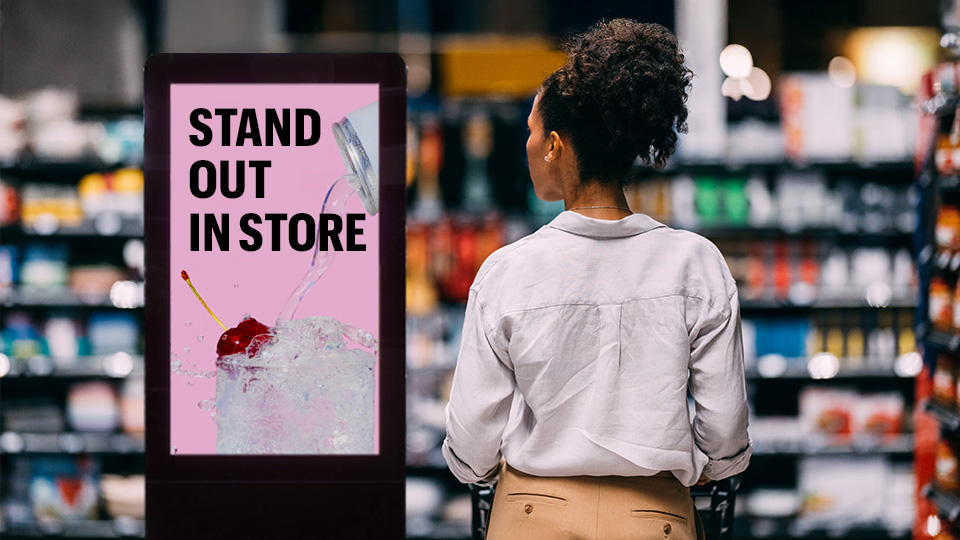
The share of Gen Z and Millennial consumers who say waiting in line for a hyped retailer is part of the fun, according to new research conducted by The Harris Poll and presented by Quad. The report, titled “The Return of Touch,” indicates that consumer preferences are rebalancing toward tangible experiences after years of digital fascination — a vibe shift that potentially impacts all marketers. This renewed emphasis on tactility, especially prevalent among younger consumers, extends beyond in-store retail and includes physical branded materials, such as catalogs and mailers.
130 million
The monthly audience for Amazon Prime Video’s ad-supported tier in the U.S., as announced at the company’s upfront presentation on Monday. (This figure represents overall reach, not the number of subscribers.) The tech giant says that 88% of these ad-supported viewers also shop on Amazon — a crucial metric for its integrated streaming-and-retail platform strategy.
400,000
The approximate number of pieces required to build one of Lego’s operational, 2,200-pound replica Formula 1 racecars. The Danish brand just rolled out 20 of these creations at the Miami Grand Prix, where drivers did a parade lap in their Lego cars (top speed: 12.5 mph) before the race — a splashy activation for a multi-year partnership between the toymaker and the pro racing series.
4%
The projected year-over-year growth in U.S. ad spending in 2025, per a MediaPost analysis of a new report from Guideline. The forecast — based on Q1 spend, advance buys, historic trends and macroeconomic data — shows double-digit growth in the digital category.
$47
The average amount that U.S. consumers spend on a pair of denim jeans, keeping them for an average of eight years and averaging three wears per week, according to research from Cotton Inc., a nonprofit cotton-growers trade organization.