Press Kit: The Return of Touch

Download the latest research, infographics, expert quotes and other exclusive content across the “return of touch” movement.

Overview

In 2007, the launch of the iPhone redefined what it meant to touch technology. Today, screen-fatigued consumers feel overwhelmed with the digital landscape, resulting in a shift toward more tactile and sensory experiences. This pendulum swing is what we call Return of Touch.

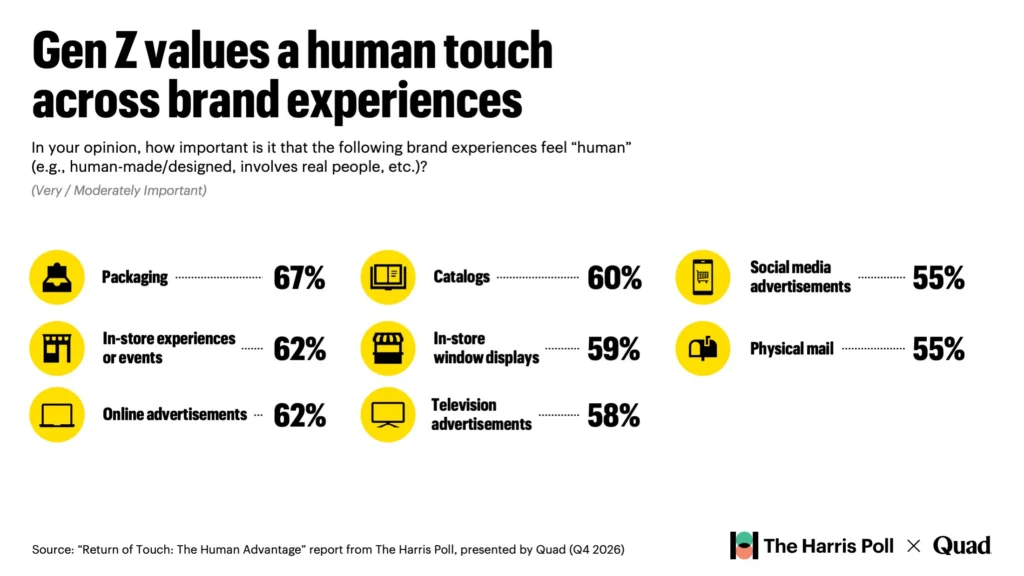
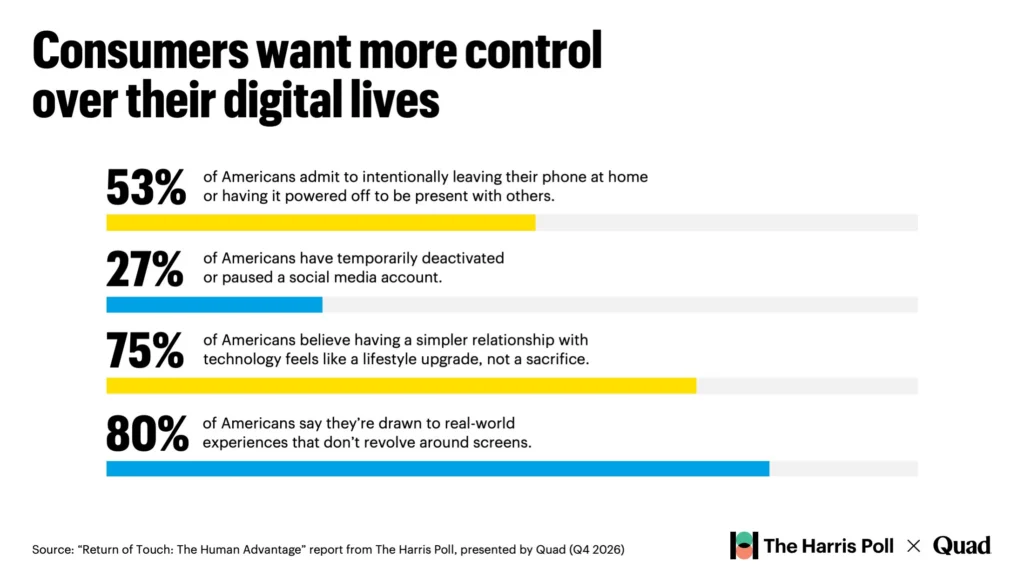
For the better part of two years, The Harris Poll and Quad have been following this trend with a regular cadence of consumer research. The most recent study, “Return of Touch: The Human Advantage,” explores the extent to which Americans — in particular Gen Z and millennials — value human-centric experiences, media, products and branding. The findings provide key data points and new perspectives about consumer sentiment for 2027.

Research report
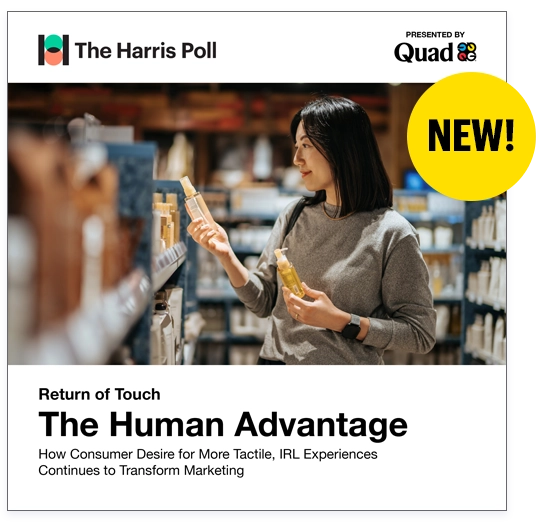
RoT: The Human Advantage cover with a "New!" sticker

Return of Touch: The Human Advantage

How consumers desire for more tactile, IRL experiences continues to transform marketing.

Key stats

What the experts are saying

Portrait of Heidi Waldusky

“The idea is not that digital is bad and tactile experiences are good. It’s that consumers don’t want one-dimensional relationships with brands. In classic human nature fashion, they seek out what’s real. No matter what you’re marketing, the opportunity is not to choose between digital and physical, but to make each interaction do more. That means focusing on what’s meaningful and memorable, not just efficient.”

— Heidi Waldusky, VP of Brand, Content & Creative

“People are telling marketers something practical: they want technology to make life easier and want brand experiences that feel real. When 80% of respondents say human, imperfect brands stay with them more than AI-generated perfection, it’s a reminder that authenticity matters more than ever: from the messages they see on-screen to the package or product they hold in their hands. Marketers must combine digital presence with real-world experiences that engage the senses and make the brand feel more tangible, trustworthy and memorable.”

— Tim Maleeny, Chief Client Strategy & Integration

Tim Maleeny headshot

Press release

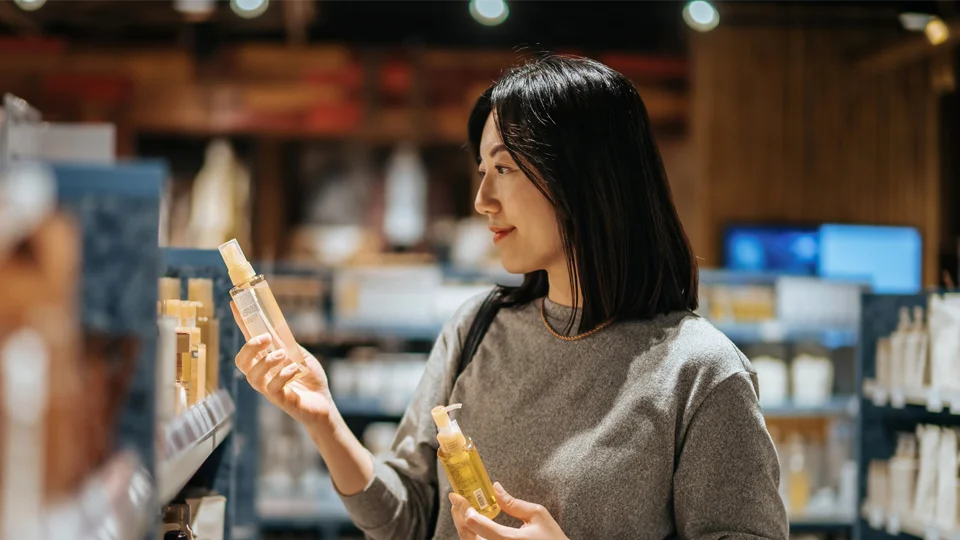
A woman touching and comparing beauty products while shopping

Research from The Harris Poll and Quad reveals how brands should interact with digitally fatigued audiences.

In the news

Archive
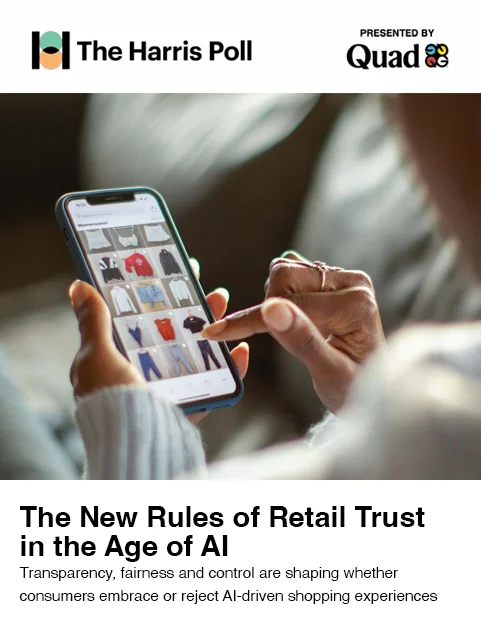
The new rules of retail trust in the age of AI cover thumbnail

The New Rules of Retail Trust in the Age of AI

Transparency, fairness and control are shaping whether consumers embrace or reject AI-driven shopping experiences.

Cover for The Return of Touch Report: Holiday Shopping, Reconnected from The Harris Poll, presented by Quad

The Return of Touch Report: Holiday Shopping, Reconnected

New research reveals consumer preferences for catalog shopping and brick-and-mortar retail in 2025.

The Return of Touch Report by The Harris Poll, presented by Quad report cover

The Return of Touch Report: Reimagining Consumer Engagement in 2025

Report: Today’s consumers want more tactile and retail experiences that foster community, good vibes and deeper brand loyalty.

Research methodology

  1. This study was conducted by The Harris Poll on behalf of Quad from July 23 to August 12, 2026, among 2,004 U.S. adults ages 18 and older. This year’s wave includes 134 Gen Z (ages 18-29), 509 Millennials (ages 30-45), 562 Gen X (ages 46-61) and 738 Boomers (ages 62 and older). Data are weighted where necessary by age, gender, region, race/ethnicity, household income, education, marital status, size of household, employment status and political party affiliation to bring them in line with their actual proportions in the population. Respondents for this survey were selected from among those who have agreed to participate in our surveys. The sampling precision of Harris online polls is measured by using a Bayesian credible interval. For this study, the sample data is accurate to within +/- 3.0 percentage points using a 95% confidence interval. This credible interval will be wider among subsets of the surveyed population of interest.
  2. This research is the second year of a multi-year study, with trended questions revealing consistent beliefs from year one. It also references findings from a similar study conducted from January 16 to February 5, 2025, among 2,068 U.S. adults ages 18 and older. Throughout the report, respondents are interchangeably called Americans / consumers, with both terms referring to the total sample from the survey.
  1. This report is based on a custom survey that was conducted online within the United States by The Harris Poll February 5 to 7, 2026, among 2,180 American adults aged 18 and over.
  2. This research comprises 370 Gen Z (ages 18–29), 715 Millennials (ages 30–45), 560 Gen X (ages 46–61) and 535 Boomers (ages 62 and older).
  1. This report is based on a custom survey that was conducted online within the United States by The Harris Poll between September 18 to 20, 2025, among 2,105 American adults aged 18 and over.
  2. This research comprises 360 Gen Z (ages 18-28), 629 Millennials (ages 29-44), 547 Gen X (ages 45-60) and 569 Boomers (ages 61 and older).
  1. This survey was conducted by The Harris Poll on behalf of Quad from January 16 to February 5, 2025, among a nationally representative sample of 2,068 U.S. adults.
  2. This research is comprised of 125 Gen Z (ages 18-28), 492 Millennials (ages 29-44), 571 Gen X (ages 45-60), 806 Boomers (ages 61-79) and 74 Silent/Greatest (ages 80 and older).
  3. Respondents for this survey were selected from among those who have agreed to participate in our surveys. The sampling precision of Harris online polls is measured by using a Bayesian credible interval. For this study, the sample data is accurate to within +/- 3 percentage points using a 95% confidence interval. This credible interval will be wider among subsets of the surveyed population of interest.
  4. Throughout the report, respondents are interchangeably called Americans / consumers, with both terms referring to the total sample from the survey.

Logos

By downloading any of these images, you agree that your use of these images will comply with our guidelines. You are not allowed to use these images to commercialize or otherwise sell products and services without the express written permission and license of Quad/Graphics, Inc., or The Harris Poll.